DSMC_2D.xlsはMicrosoft Excel上で動作するDirect Simulation Monte Carlo (DSMC) [1-4] の2次元汎用コードです.Excelシートのセルを計算格子のcellに見立てて形状入力したら楽なのでは?と思い,Excelのマクロとして組み込んでみました.
DSMC_2D.xls is a Direct Simulation Monte Carlo (DSMC) [1-4] code which runs on Microsoft Excel. Its featuers are listed below. Virtual Solid Cell (VSC) [5] is a new feature of Version 1.1.4 and later, which can mimic porous media and surface roughness.
現バージョンでの主な特徴は下記の通りです. Version 1.1.4以後のバージョンには,多孔質体をや表面粗さをモデル化するための独自の新技術Virtual Solid Cell (VSC) [5]を搭載しています.
【開発・計算環境】
【動作確認済のMS-Excelバージョン】
【参考文献】
- G. A. Bird: Molecular Gas Dynamics, Clarendon Press, 1976.
- K. Nanbu: Stochastic Solution Method of the Boltzmann Equation I, Mem. Inst. Fluid Sci., Tohoku Univ., 3 (1992), pp. 47-93.
- K. Nanbu: Theory on the Monte Carlo Simulation of Rarefied Flows Based on the BGK, Holway, Kac, and Boltzmann Equations, Mem. Inst. Fluid Sci., Tohoku Univ., 5 (1994), pp. 83-120.
- K. Nanbu: Stochastic Solution Method of the Boltzmann Equation II, Gas Mixture, Diatomic Gas, Reactive Gas, and Plasma, Mem. Inst. Fluid Sci., Tohoku Univ., 7 (1997), pp. 53-101.
- K. Denpoh: Virtual Solid Cell Model for Mimicking Porous Media in Rarefied Gas Flow Analysis Based on Direct Simulation Monte Carlo Method, 66 (2023), pp. 490-495.
ダウンロード![]()
|
解析例 #1 Flow passing through a Slit
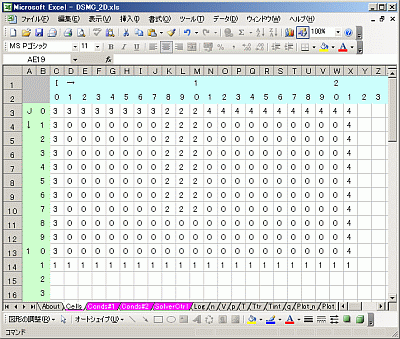
Fig. 1(a) Cells (0-Gas, 1-Symmetry, 2-Slit wall, 3-Inlet, 4-Outlet).
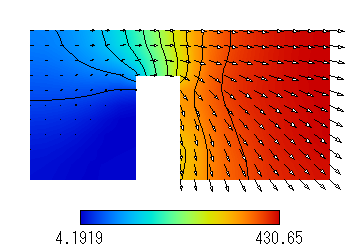
Fig. 1(b) Flow velocity (m/s). (N2, Kn=1.10)
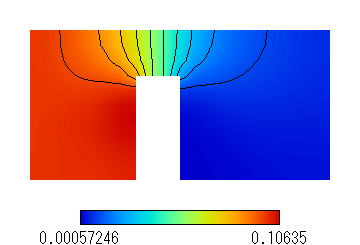
Fig. 1(c) Pressure (Pa) distribution. (N2, Kn=1.10)
解析例 #2 Cavity Flow
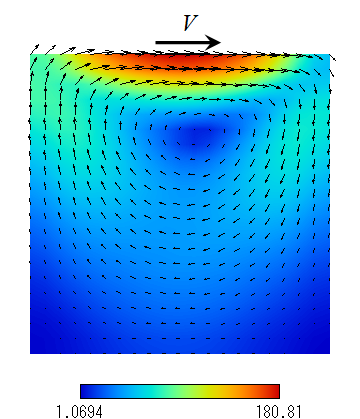
Fig. 2 Lid driven cavity flow. (Ar, Kn=0.1)
解析例 #3 Gas Heat Conduction in a Microgap between Surfaces
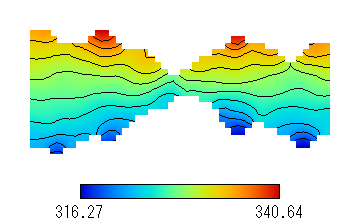
Fig. 3(a) Temperature (K). (He, 363 K at top, 293 K at bottom, Kn=4.54)
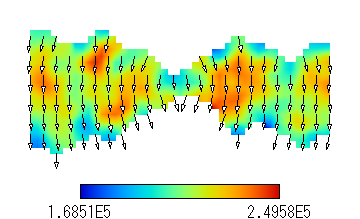
Fig. 3(b) Heat flux (W/m2). (He, 363 K at top, 293 K at bottom, Kn=4.54)
解析例 #4 Crookes Radiometer / クルックス ラジオメーターの原理
K. Denpoh, Another Possible Origin of Temperature and Pressure Gradients across Vane in the Crookes Radiometer, J. Vac. Soc. Jpn., 60 (2017), pp. 471-474.
[Paper] [Presentation]
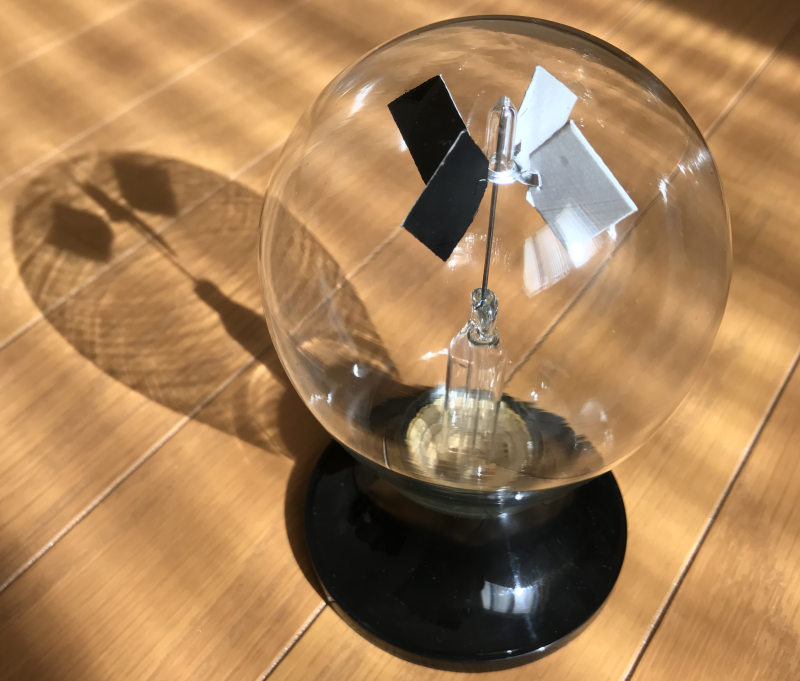
In conventional studies on the Crookes radiometer, the vane temperature was presumed to be higher at the black side than at the shiny side. In this study, a new hypothesis - the vane is isothermal but accommodation coefficients are different at the black side and at the shiny side - has been proposed and examined using heat transfer and Direct Simulation Monte Carlo (DSMC) simulations. The results prove that the vane is indeed isothermal under the sunlight and that gas temperature and pressure at the black side with the perfect accommodation coefficient become higher than those at the shiny side with a small accommodation coefficient. The pressure gradient across the vane acts as an area force to push the vane from the black side. It is also found the glass bulb temperature strongly affects the revolution of the vanes.
羽根の温度が黒色面と反射面で異なるのではない。熱適応係数が異なるために生じる現象である。
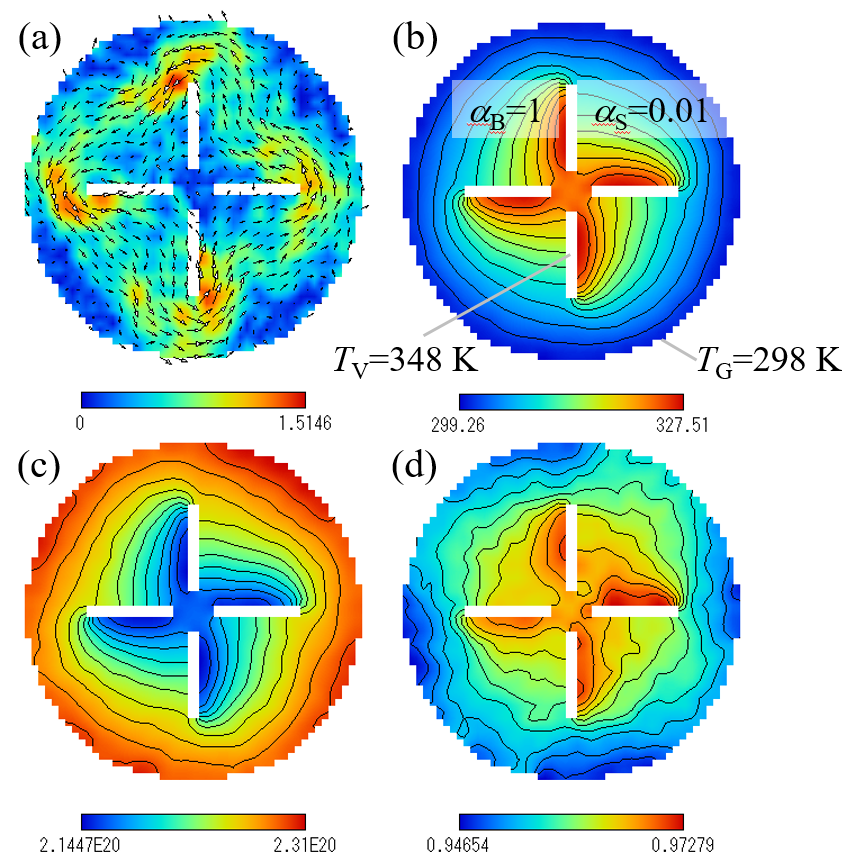
Fig. 4 (a)Velocity (m/s), (b)temperature (K), (c)density (m-3), and (d)pressure (Pa).
解析例 #5 Rarefied Flow passing through Porous Media Wall
Porous media walls can be modeled with random solid cells (RSCs) at Ver. 1.1.3 or less. The results show that the gas flux passing through the porous media is essentially independent on its temperature Tw at a fixed sticking coefficient Sc. In contrast, the flux is strongly affected by Sc. As expected, the flux decreases with increasing Sc. Furthermore, the gas flux is inversely proportional to the squre root of the molecular weight (MW), indicating that the flux is related to the Knudsen diffusion.

Figs. 5(a)-(d) N2 flow velocity and pressure. (Oct 21, 2017)
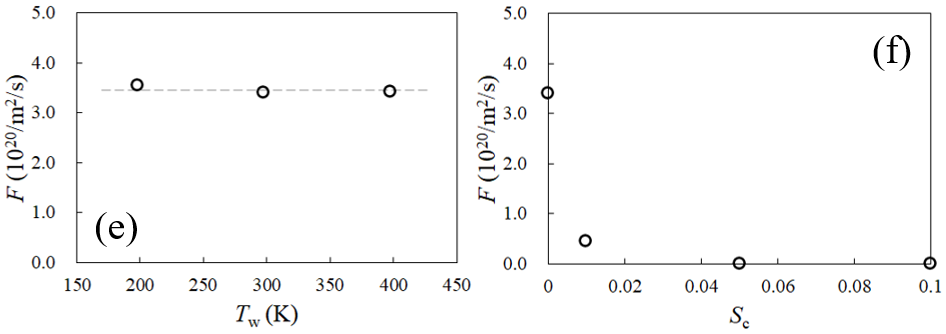
Figs. 5(e)-(f) N2 flux passing through porous media. (Aug 15, 2021)
Effects of temperature (Sc=0) and sticking coefficient (Tw=298 K).
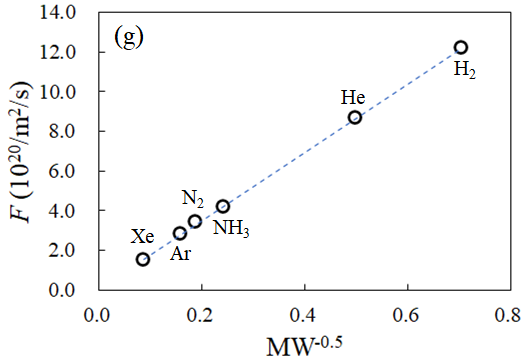
Fig. 5(g) Flux passing through porous media as a function of
molecular weight (MW). (Mar 26, 2022)
解析例 #6 Virtual Solid Cell (VSC)
Figures 6(a)-(g) demonstrate our new technology, Virtual Solid Cell (VSC), which is a new feature of Ver. 1.1.4 and later. Porous media described by the conventional RSC model (Example #5 above) is replaced with a stochastic procedure in the VSC model. Thus, the VSC model enables one-dimensional (1D) simulations of a rarefied gas flow passing through homogeneous porous media, contributing to a significant reduction in computation time. It also facilitates the treatment of complex porous media with various porosities. Furthermore, the VSC model shows its potential as a new boundary model to describe surface roughness and conditions. In adittion, the temperature inside the thermal insulator covering the re-entry capsule can be calculated using VSC.
K. Denpoh: Virtual Solid Cell Model for Mimicking Porous Media in Rarefied Gas Flow Analysis Based on Direct Simulation Monte Carlo Method, 66 (2023), pp. 490-495.
[Paper] [Presentation]
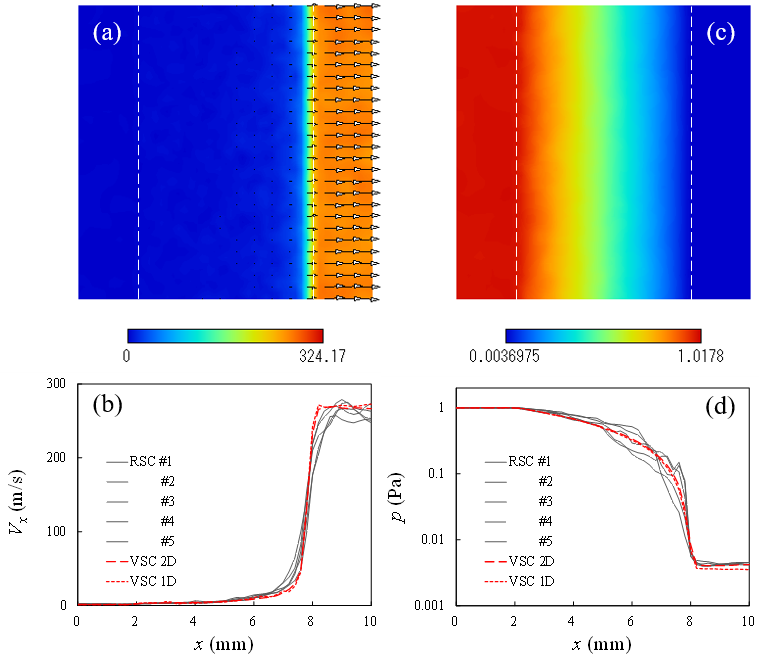
Figs. 6(a)-(d) Velocity and pressure of N2 flow passing through a porous
media wall. Comparsions between the RSC and VSC models.
(Oct 04, 2022)
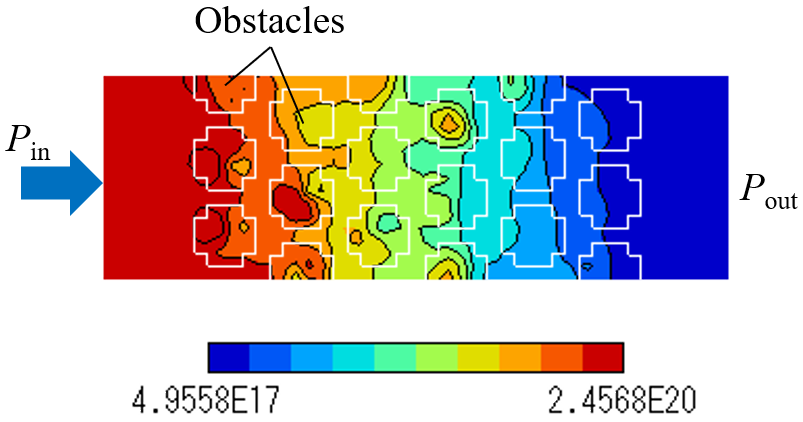
Figs. 6(e) Number density of N2 flow passing through a porous media
wall (porosity=0.445) formed with multiple porous obstacles (porosity=0.1).
Pin and Pout are 1 Pa and 0 Pa, respectively. (Sep 29, 2022)
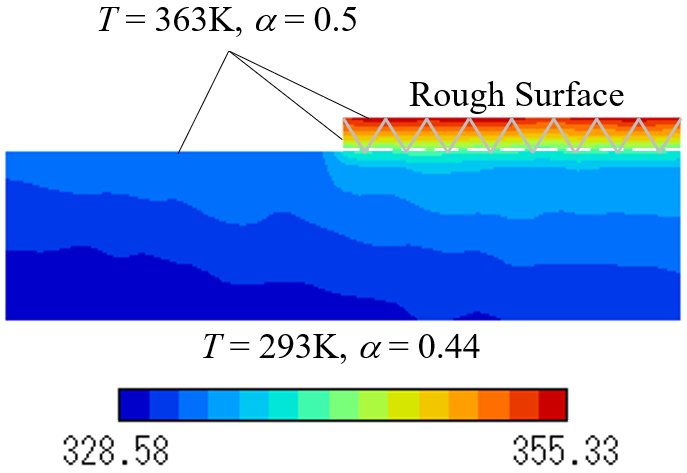
Fig. 6(f) He gas temperature between parallel plates (Kn=4.59).
(Sep 19, 2022)
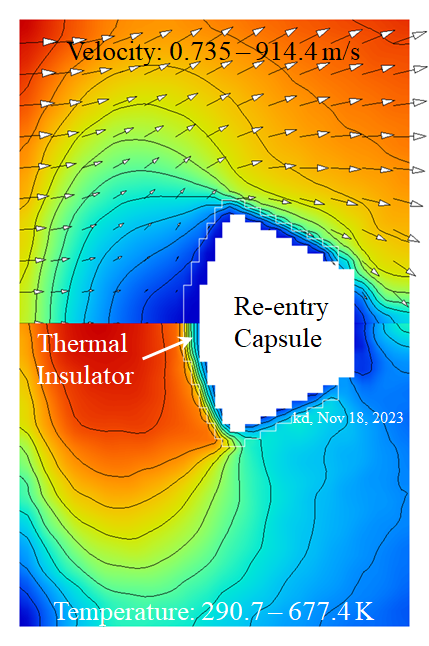
Fig. 6(g) Velocity and temperature distributions around re-entry capsule,
which is covered with thermal insulator (Air, Kn=0.218, Ma=3.72).
(Nov 18, 2023)
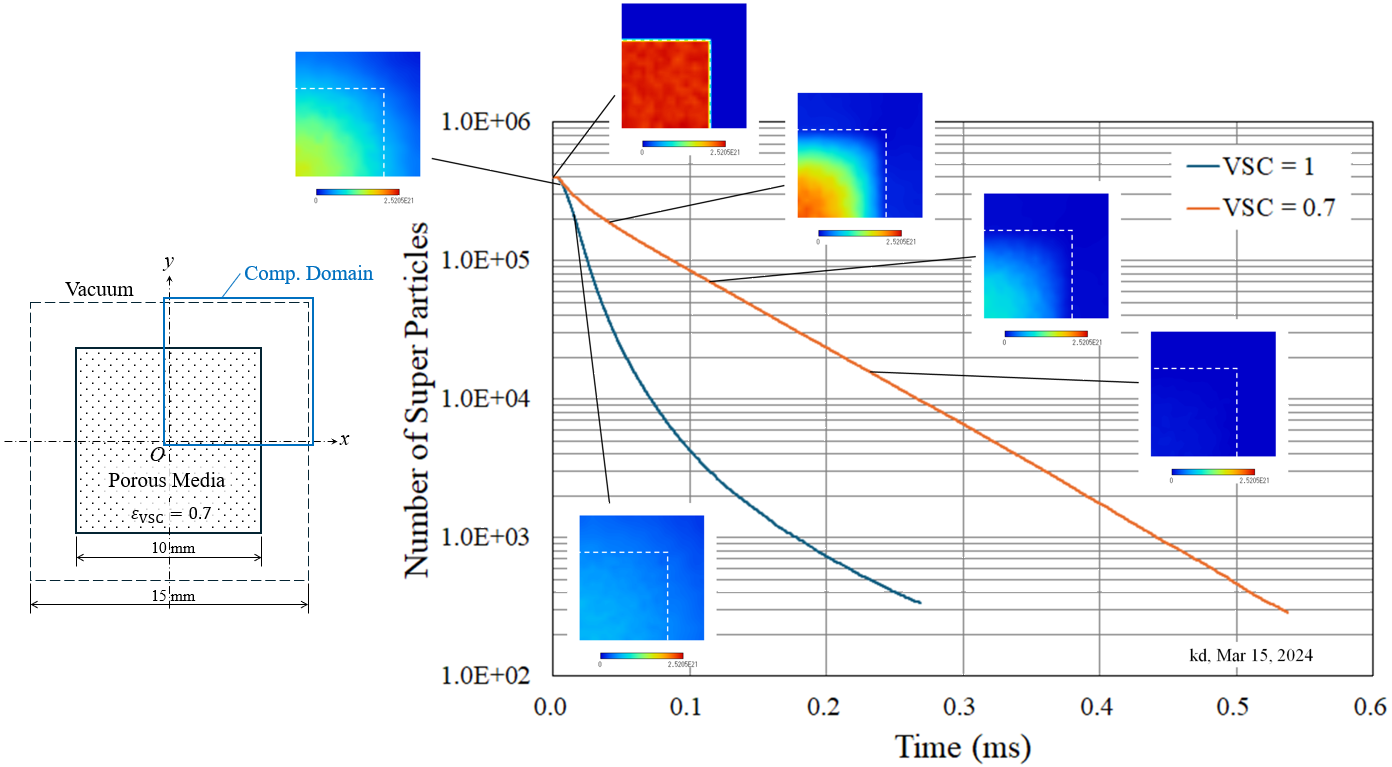
Fig. 6(h) Vacuum drying of porous media. Time-variation of H2O density.
(Mar 15, 2024)